

Marketing Mix Model
Deliverables
Incrementality by Channel and Tactic
The core deliverable: for each channel and tactic, how many conversions it actually drove — beyond what would have happened anyway — and the cost per incremental conversion, so everything can be compared on the true cost of the growth it delivers.
Measurement goes deeper than channel-level averages. Where most MMM solutions stop at "paid search" or "paid social," Maxma measures at the tactic level: brand vs. non-brand search, social prospecting vs. retargeting, video for lead generation vs. brand awareness. That's the level where budget decisions are actually made. Maxma can also drill further to surface which campaigns are contributing most within a tactic (currently in beta).
Incrementality Over Time, Refreshed Weekly
Rather than a single point estimate from an annual study, every channel and tactic gets a trendline of incrementality and cost per incremental conversion, updated weekly on the Maxma platform. You see how real incremental performance shifts with creative changes, budget moves, and tactic shifts — and when you try something new, its measured impact shows up as quickly as a week later.
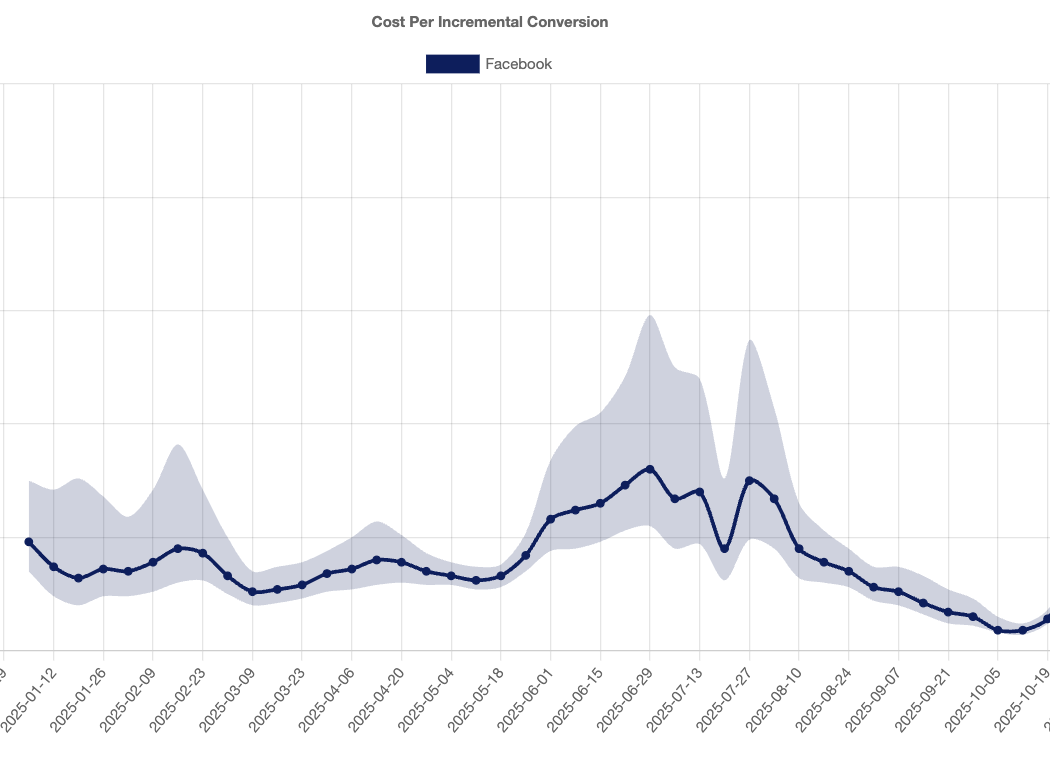
This is what turns measurement into a feedback loop: scale spend and watch whether the incremental cost holds — catching efficiency problems while there's still time to fix them, not in next year's study.
Response Curves: Where Each Channel Has Room to Scale
Incrementality tells you what a channel delivered at its current spend; the response curve tells you what happens if you spend more. Each channel is positioned on its curve:
- Under-spent — still in the steep part of the curve, where additional budget drives meaningfully more conversions. The signal to lean in.
- Saturated — returns are flattening and each additional dollar buys less. The signal to hold, reallocate, or expand to new audiences instead.
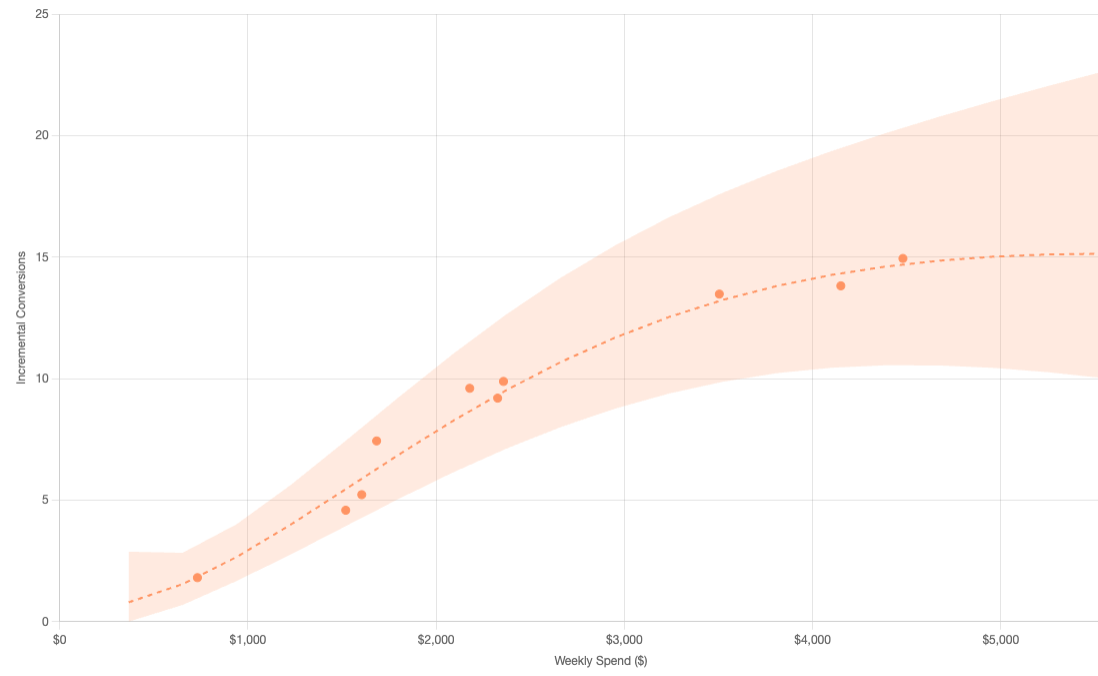
This is how NinjaOne scaled into 5+ top-of-funnel channels like YouTube and CTV: response curves showed where each channel sat as spend grew, guiding when to lean in, hold, or reallocate — driving substantial inbound growth at 30%+ lower incremental CPA than their saturated performance channels.
The Full Picture of What Drives Conversions
MMM doesn't only score your paid channels. It breaks down your conversions across all drivers — paid channels and tactics, organic and SEO, seasonality and trends, and external factors — so you can see how much of your growth is truly marketing-driven and how much would arrive on its own.
That context protects you from the classic trap: a channel that looks great in platform reporting but is mostly harvesting conversions the baseline or other channels would have delivered anyway.
Budget Recommendations and Forecasts
The measurement rolls up into direct planning support:
- Budget optimization — simulate scenarios (optimize the current budget, scale it up, or pull it back) and get a recommended allocation across channels built to maximize total conversions and ROI.
- Sales forecasting — project business outcomes under a chosen budget plan and conditions such as seasonality, so teams can plan operations against what marketing is actually expected to deliver.
Together, these answer the questions budget planning actually asks: which channels earn their spend, which have room to grow, and where the next dollar is best deployed — refreshed as quick as every week, so you're steering with current measurement, not last year's study.